Using coronavirus monitoring in sewage to fight COVID-19
Roadmap for Municipal Public Health professionals | Deze pagina in het Nederlands
Version August 29, 2022
These guidelines are designed to show Municipal Public Health Service (GGD) professionals how to use the sewage measurements as shown on the Coronavirus Dashboard provided by the Government. These guidelines are intended to support GGD-professionals working in infectious disease control in gaining an understanding of the transmission and epidemiology of COVID-19 based on sewage figures.
The sewage figures can contribute to determining the level of infection in the region in conjunction with other indicators. Changes in the circumstances of the epidemic, such as an increasing vaccination coverage or policy changes, cause the relationship between and interpretation of the various factors to fluctuate.
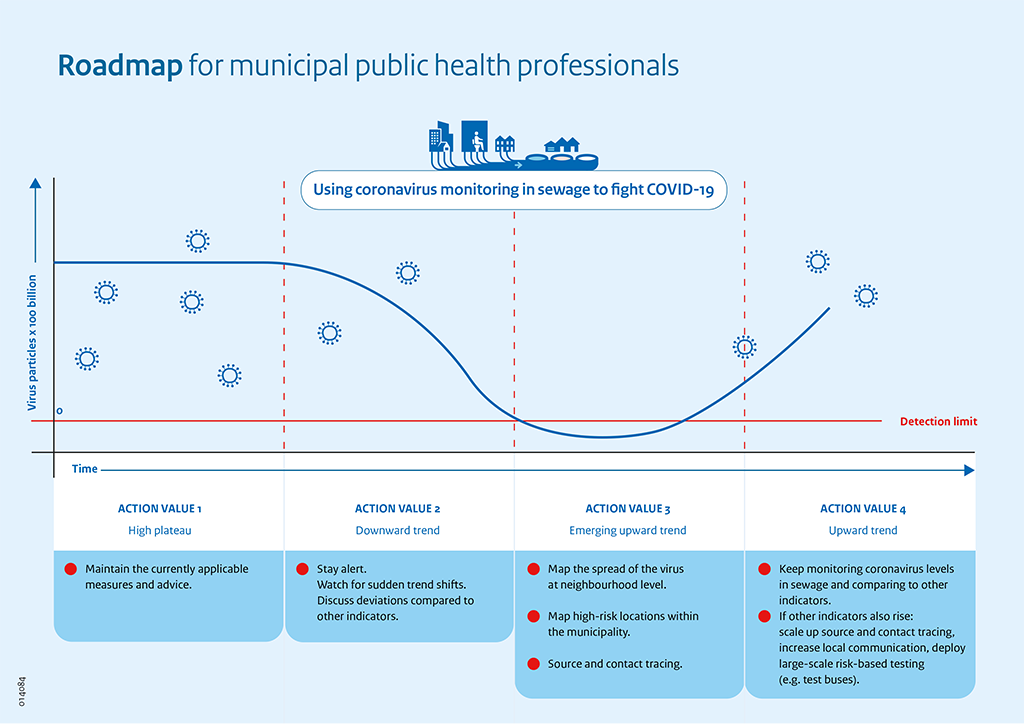
Figure 1. The action values apply to the sewage figures for the coverage areas of sewage treatment plants (STPs). These figures are available on coronadashboard.government.nl. Look under ‘Virus particles in wastewater’ for more detailed figures on sewage (wastewater) measurements. Search for a municipality. This will give you the most recent value and a graph of historical values. At the top of the graph, you will find a drop-down menu. This allows you to view sewage (wastewater) figures per STP.
1. Introduction
Since the beginning of 2020, RIVM has been carrying out measurements of the number of SARS-CoV-2 virus particles in sewage in the Netherlands to monitor the spread of the virus. From the beginning of September 2020 measurements have been carried out at all 300 sewage treatment plants (STPs) in the Netherlands. Additional information on sewage research is available on the RIVM website and in the Sewage Measurements on the Government Coronavirus Dashboard brochure (in Dutch) developed for and in partnership with GGD-professionals.
On the Coronavirus Dashboard, sewage measurements are shown at the national level as well as broken down by safety region and by municipality. Multiple municipalities may discharge sewage at a single STP. Conversely, a single municipality may discharge sewage at several STPs. The allocation of the number of virus particles per municipality is based on the number of connected inhabitants. As a result, the allocation per municipality is an approximation of the actual number of virus particles discharged.
The purpose of this road map is to provide clarity and potential actions to be taken based on the trends in sewage measurements. These trends are associated with specific action values and potential actions at the STP level.
The Coronavirus Dashboard shows sewage measurements at both safety region and municipality level. The Statistics Netherlands (CBS) shows which safety region of municipality the STP is linked to. It also shows which percentage of the sewage treated at the STP comes from inhabitants of the connected municipality/municipalities.
Various potential actions are provided for each action value. Ultimately, the GGD will determine what action will be taken at the local level. The sewage figures can serve as a supplement to the regional surveillance that takes place within the GGD and may contribute to accounting for the spread of the SARS-CoV-2 virus in the GGD region.
2. Step-by-step plan overview
Sewage figures may go down, remain stable, go up or rise again from zero (i.e. when no virus particle presence is detected). Depending on the trend of the sewage figures, we provide distinct action values coupled with a recommendation on what you can do to gain further insight into the spread of the virus. These action values are not consecutive by nature, but are linked to the trend of the sewage figures at STP level. The action values are related to the stage of the epidemic. It is therefore vital to always take into account i) the national trend of the sewage figures and ii) the stage of the epidemic based on other indicators and current national policy. If the trend at STP level stands out compared to the above, we recommend caution. A distinction is made between the following four action values:
- Action value 1: sewage figures show a plateau with high values.
- Action value 2: sewage figures show a downward trend.
- Action value 3: sewage figures show viral loads after at least seven days during which the virus was not detectable in the sewage.
- Action value 4: sewage figures show an upward trend.
In Figure 1, the sewage measurement values are represented by the dark blue curve, while the boundaries of the stages during which the action values apply are shown using dotted red lines. The detection limit below which a virus cannot be detected is shown in red.
2.1 Action value 1
The sewage figures show a plateau where the sewage figures exceed 750 x 100 billion (1014) virus particles per 100,000 inhabitants on more than seven days in a row. This viral load indicates a relatively high virus circulation. This value is based on the link between omicron variant viral loads in sewage and the number of hospitalisations. In the event of such a high virus circulation, we recommend enforcing all applicable national measures and advice. Please note that the aforementioned value of 750 x 100 billion (1014) virus particles per 100,000 inhabitants is based on data from the period in which the omicron variant was dominant. If new variants become dominant, this value will need to be re-evaluated. New variants may affect both the seriousness of the clinical picture and the degree of viral shedding.
2.2 Action value 2
The sewage figures show a downward trend. At this stage, we recommend that the sewage figures be monitored in order to be able to flag any potential change in the trend quickly. As an example, the downward trend of the sewage figures could be the result of the increasing vaccination coverage (e.g. as a result of booster vaccinations that may or may not offer better protection against current and new variants of the virus), given that recently vaccinated people lead to fewer infections taking place, resulting in less viral shedding. At present, no information is available regarding the viral load in the faeces of vaccinated people compared to unvaccinated people.
It may be that the downward trend of the sewage figures differs from the trend of other indicators. In this case, we recommend remaining vigilant and discussing this observation within the surveillance structure of the GGD.
2.3 Action value 3
The sewage figures show that there is a persisting low or a revival in SARS-CoV-2 circulation within the coverage area of the STP. It is vital to monitor whether or not this trend will persist. If the indication provided by the sewage figures differs from other indicators, we recommend monitoring the situation more closely. In the event that measurements show virus particles after seven days during which the virus was not detectable, the following options are available, depending on the stage of the epidemic and the seriousness of the clinical picture.
-
Identifying the spread of COVID-19 within the municipality based on other indicators
Are there any data on hospital admissions or other indicators, such as from the Infection Radar or Nivel monitoring stations, that could potentially account for the revival shown by the sewage figures?
You may be able to interpret the indication provided by the sewage figures by examining indicators at the local level that provide a picture on the spread of SARS-CoV-2 in the relevant municipality and, if possible, at the district level. This includes the incidence of infections or symptoms, willingness to test for COVID-19, vaccination coverage and the occurrence of so-called SARS-CoV-2 Variants of Concern. Also compare these indicators with those for surrounding municipalities. -
Interpreting the indication: assessing potential causes and risks within the relevant municipality in consultation with the municipality and water board
Are there any high-risk locations within the municipality from which the indication could have originated?
Identify whether there are any high-risk locations within the municipality or in adjacent municipalities that can account for the indication. This includes hospitals, asylum seekers’ centres, health care institutions or other locations at which large numbers of people could be shedding the virus simultaneously, such as large companies, large-scale student accommodation and schools. In addition, data from GPs remain a key source of information. There may also be locations that can distort the indication provided by the sewage figures, such as industry. Furthermore, recreational areas may also contribute to a distorted picture. If a municipality includes a recreational area that is visited by a large number of tourists who live outside of the municipality, then more people may be shedding virus particles than the number of connected residents. This may lead to a distorted picture, given that the viral loads are calculated on the basis of the number of connected residents per sewage treatment plant, which remains the same over time.
Any high-risk locations and locations that may distort sewage figures should be identified in partnership with the municipality. In the event of any ambiguity in interpreting or specifying the indication, consultation can take place with the relevant water board. The water board may be able to carry out additional research, for example into the sewage flows, or schedule additional sampling at district level.
2.4 Action value 4
The sewage figures indicate increasing circulation of SARS-CoV-2 in the relevant coverage area. It is vital that you closely monitor whether this trend of the sewage figures persists and/or other indicators are following this trend.
If the trend continues, we recommend investigating the cause of the increase further, depending on the stage of the epidemic and the seriousness of the clinical picture. A trend is considered persistent when three measurements in a row show an increase or decrease. In this case, the sewage figures can serve as one of the indicators within the surveillance structure of the GGD.
In the event that the sewage should exceed the value of 750 x 100 billion (1014) virus particles per 100,000 residents, similar to Action value 1, we recommend enforcing all national measures and advice related to the stage of the epidemic we are in at that moment.
3. More information
Additional information on sewage research and publication of the data on the Coronavirus Dashboard is available on the RIVM website and in the Sewage Measurements on the Government Coronavirus Dashboard brochure (in Dutch) developed for and in partnership with Municipal Public Health Service professionals.
In the event of any questions regarding the interpretation of the figures and any control measures, please phone the National Coordination Centre for Communicable Disease Control (LCI) on 088-6897000. In addition, you can contact RIVM’s National Sewage Monitoring team at afvalwatersurveillance@rivm.nl.
Version control
- 29-08-2022: Fully revised version. Some out-of-date parts are removed.
- 29-07-2022: New version of figure 1 (editorial and web accessibility)
- 11-03-2022: First translated version.